アウトプット
アウトプットイメージ
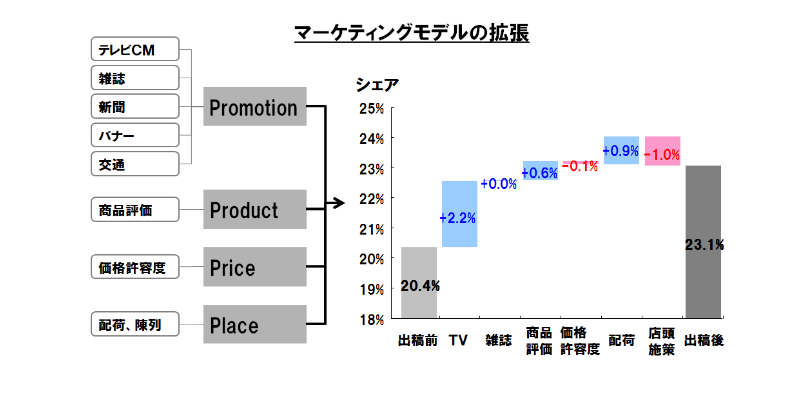
広告宣伝以外の要素も含め、4Pの視点でマーケティングモデルを構築することで、シェアの拡大・減少の要因を把握可能です。
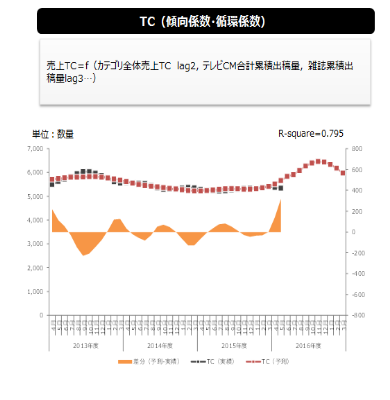
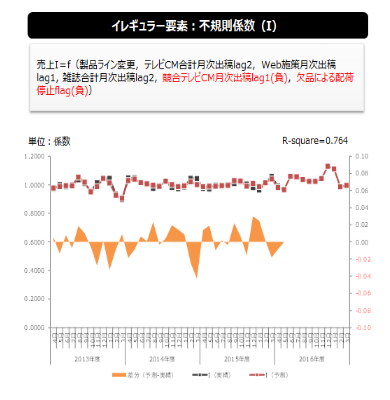
TC(傾向係数・循環係数)とI(不規則係数)の予測結果
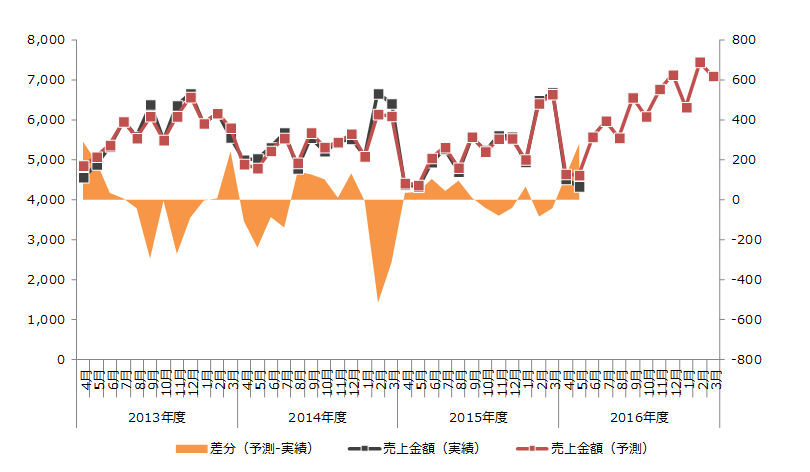
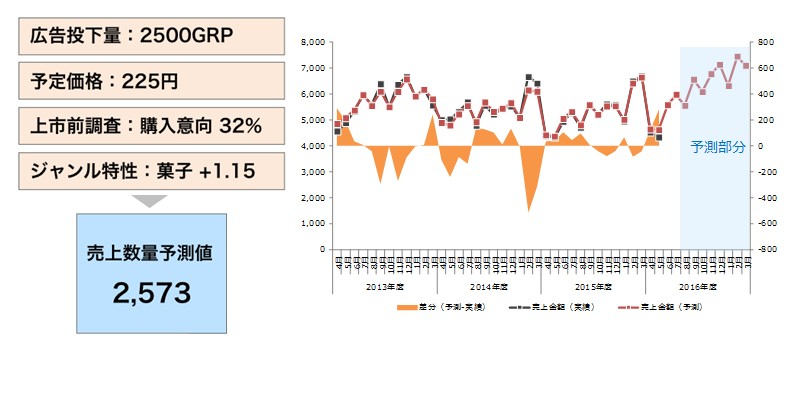
月次売上数量の予測値と実測値(売上予測シミュレーション)
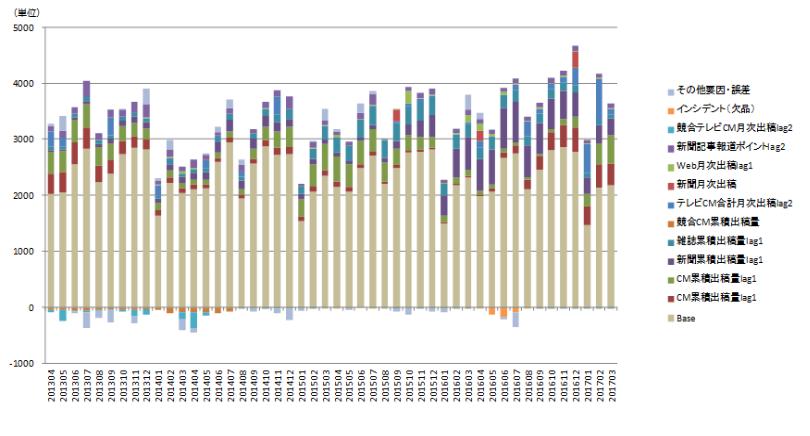
月次売上数量の要素分解(Decomposition)
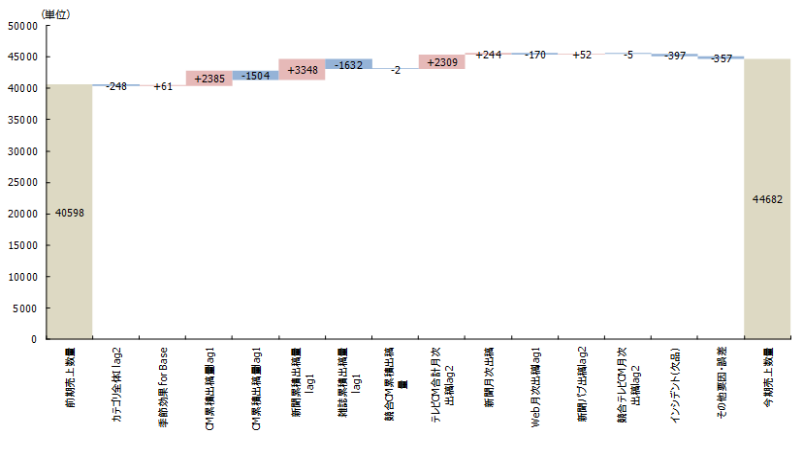
要素別の前期vs.今期売上貢献度比較(Waterfall)
活用シーン
予測モデルの結果(シミュレーションツール)は、売上予測や新商品需要予測、マーケティングROI算出など、さまざまな場面で活用できます。
売上予測・新商品需要予測
生産量の計画・調整への活用や予実管理によるPDCAの運用。目標を売上が下回った場合は戦略の実効性の見直しなどに活用できます。
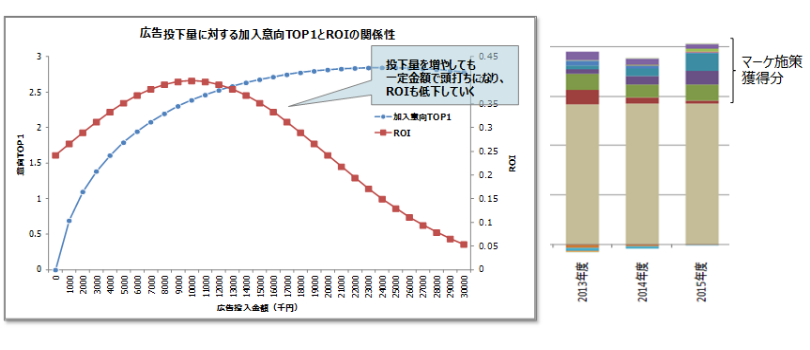
マーケティングROI算出
投資対効果に基づいた投下量の判断や戦略効率性の評価、改善などに活用が可能です。
KPI目標値達成のための必要広告投下量の推計
設定されたKPI目標値を達成するための戦略シミュレーションなどに活用が可能です。